Donut Charts
IT Visibility is being upgraded with the introduction of Technology Intelligence Platform beginning in September 2024. Flexera will contact you directly regarding the timeframe of your upgrade. With Technology Intelligence Platform, out-of-the-box IT Visibility dashboards are being replaced with new, enhanced IT Visibility Technology Intelligence Platform reports. For more information, see IT Visibility With Technology Intelligence Platform Reports.
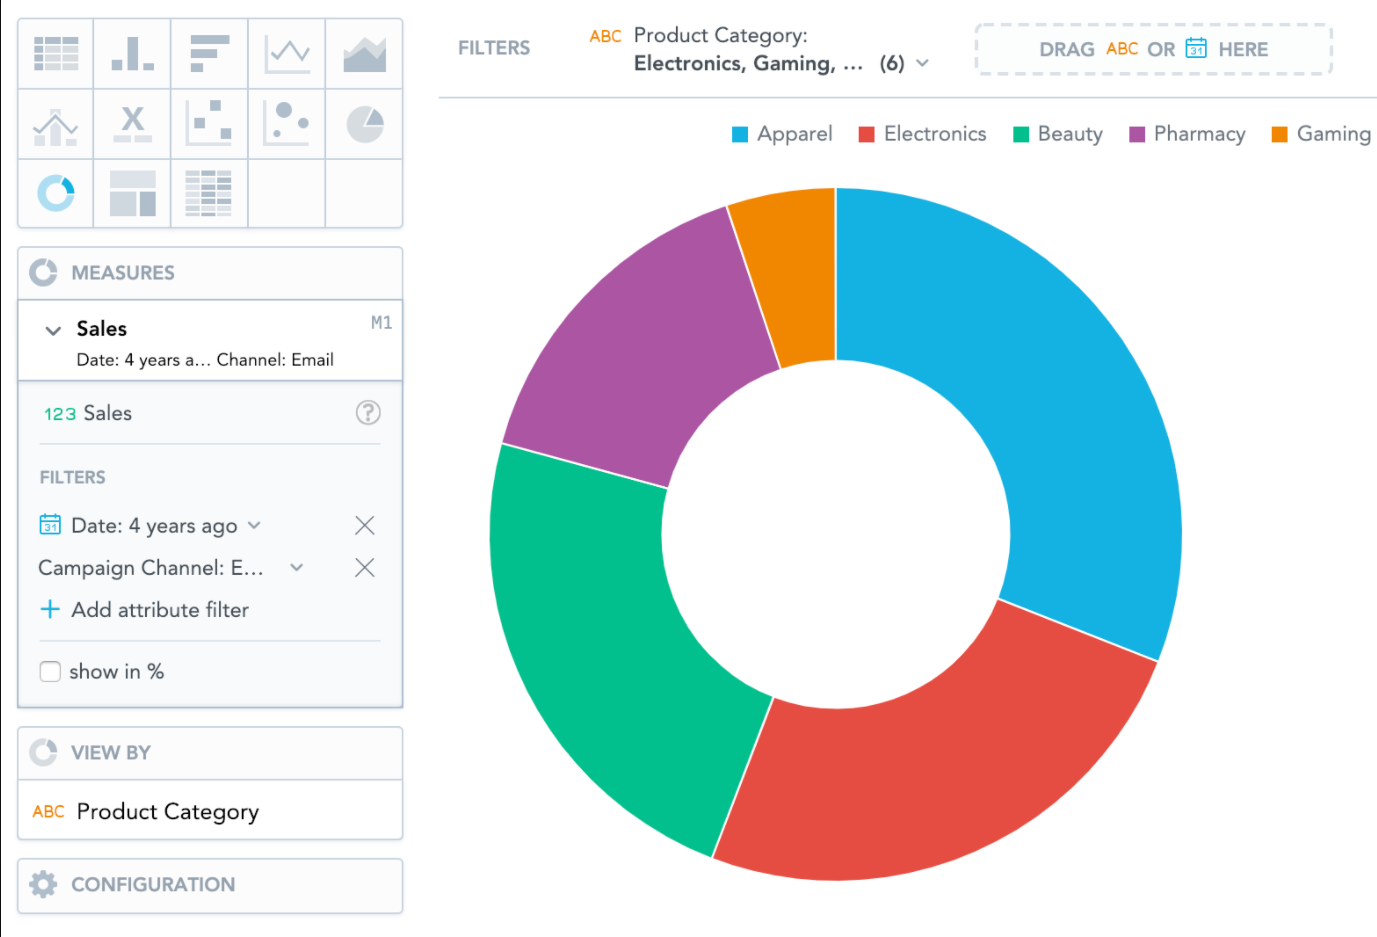
Donut charts show data as proportional segments of a disc with a hollowed-out center. Donut charts can be segmented by either multiple measures or an attribute and allow viewers to visualize component parts of a whole.
In donut charts, you can also display the values as a percentage. You must add Date or an attribute to the View by section.
For information about common characteristics and settings of all insights, see Insight Types.